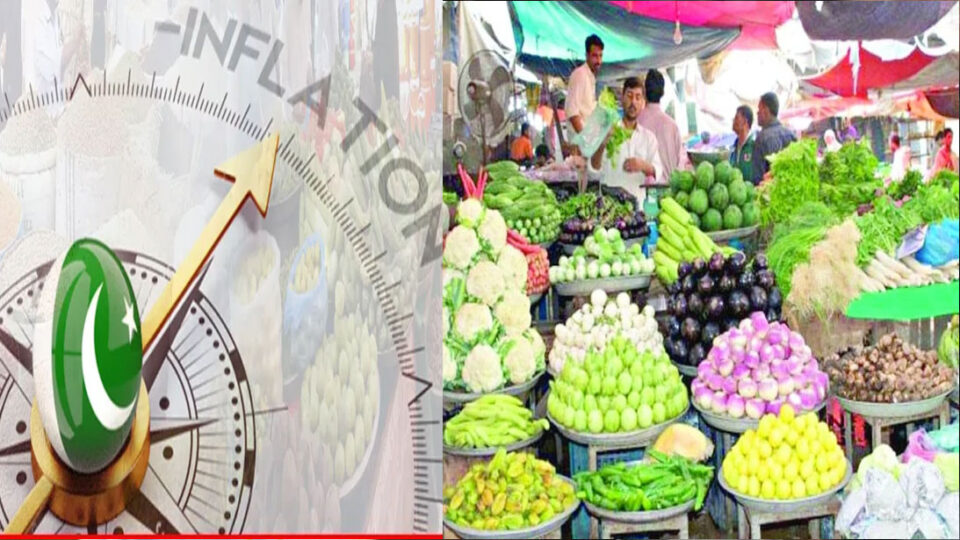
Weekly SPI Rises 0.95% Amid Soaring Chicken, Tomato Prices; Yearly Inflation Eases Slightly
KARACHI: The Sensitive Price Indicator (SPI) for the week ending July 10, 2025, recorded a 0.95% increase on a week-on-week (WoW) basis, according to the Pakistan Bureau of Statistics (PBS). The uptick was primarily driven by sharp hikes in food prices, especially perishable items.
🛒 Key Weekly Price Changes
The most notable increases were seen in:
-
Chicken: ↑ 22.61%
-
Tomatoes: ↑ 13.45%
-
Onions: ↑ 6.25%
-
Potatoes: ↑ 2.79%
-
Garlic: ↑ 2.36%
-
Sugar: ↑ 1.90%
-
Gur (jaggery): ↑ 1.89%
-
Rice (Basmati broken): ↑ 0.84%
Meanwhile, some essentials recorded price drops, offering slight relief:
-
LPG (liquefied petroleum gas): ↓ 2.56%
-
Mustard oil: ↓ 0.81%
-
Pulse moong: ↓ 0.41%
-
Cooking oil (5 litres): ↓ 0.20%
-
Wheat flour & vegetable ghee (2.5 kg): ↓ 0.02%
Out of 51 essential items tracked across 50 markets in 17 cities, 19 items saw price increases, 6 items declined, while 26 remained stable.
📉 Year-on-Year (YoY) Trend Shows 1.23% Decline
Despite the weekly hike, the SPI decreased by 1.23% compared to the same period last year. This decline is attributed to significant YoY drops in essential perishables and energy costs:
-
Onions: ↓ 50.04%
-
Tomatoes: ↓ 45.66%
-
Electricity (Q1 charges): ↓ 37.62%
-
Garlic: ↓ 22.80%
-
Wheat flour: ↓ 22.19%
-
Pulse mash: ↓ 20.46%
-
Tea (Lipton): ↓ 17.93%
-
Diesel: ↓ 1.58%
📈 Inflationary Pressures Still Felt in Daily Essentials
Despite the overall YoY drop, households continue to feel the burden of rising costs in other essential categories:
-
Ladies’ sandals: ↑ 55.62%
-
Sugar: ↑ 29.17%
-
Pulse moong: ↑ 18.89%
-
Beef: ↑ 14.71%
-
Chicken: ↑ 13.77%
-
Gur: ↑ 12.66%
-
Vegetable ghee: ↑ 12.46%
-
Firewood: ↑ 10.44%
-
Powdered milk: ↑ 9.41%
-
Lawn fabric (printed): ↑ 7.89%
-
Shirting cloth: ↑ 7.31%
These trends highlight ongoing cost-of-living pressures, particularly affecting middle- and lower-income households.
🧮 SPI Breakdown by Income Groups
The SPI is calculated weekly by PBS and serves as a barometer for short-term inflation, particularly among vulnerable households. Income group data for the week shows:
Week-on-Week (WoW) Increases:
-
Q1 (lowest income): ↑ 1.10%
-
Q2: ↑ 0.99%
-
Q3: ↑ 1.02%
-
Q4: ↑ 0.88%
-
Q5 (highest income): ↑ 0.85%
-
Combined SPI: ↑ 0.95%
Year-on-Year (YoY) Decreases:
-
Q1: ↓ 2.79%
-
Q2: ↓ 2.41%
-
Q5: ↓ 1.24%
-
Q3: ↓ 0.59%
-
Q4: ↓ 0.04%
-
Combined: ↓ 1.23%
The data indicates sharper weekly price increases for low-income groups, despite broader annual relief.
⚠️ Looking Ahead: Volatility Expected
Economists caution that while YoY inflation is easing, weekly volatility in food and fuel prices remains a concern. Effective supply chain management, policy coordination, and fiscal responsibility will be key to maintaining price stability in the months ahead.
Stay updated with the latest inflation trends, government relief measures, and economic insights on our site. Bookmark us for real-time news tailored for informed readers.

